Collecting and displaying metrics with Prometheus and Grafana
Getting monitoring up and running with Prometheus and Grafana deployed in a kubernetes cluster is surprisingly easy.
Tech Stack
Pre-requisites
These must already be installed and configured:
- K3S cluster or any kubernetes cluster. This is just what I use.
- helm handles deployments.
- cert-manager gets our certificates.
To be Configured
- Prometheus, installed with the prometheus-community helm chart.
- Grafana, installed with the Grafana helm chart.
Install
Create a new git repository for monitoring
This assumes the repository has been created as an empty repo:
| |
Install Prometheus
Create a new file in the monitoring repo called
values.yml.Add the unedited contents of the Prometheus default values.
Modify values.yml to match your needs.
These are some of the changes I’ve made to the default values. Most places insist on exposing the WebUI with kubectl port forwarding. This seems silly for just testing that the install came up. I chose to expose it through an ingress with tls certs. After verifying things look good, I disabled the ingress.
Ingress is disabled because actual interactions with Prometheus will be done via Grafana for display and config alterations for metrics scraping.
Modified ingress section of values.yml, with commented out sections removed for brevity:
YAML1 2 3 4 5 6 7 8 9 10 11 12 13 14 15 16 17 18 19 20 21 22 23 24 25 26 27 28 29 30 31 32 33 34ingress: ## If true, Prometheus server Ingress will be created ## enabled: false # IMPORTANT: set to true to enable access via prometheus.domain_name.here # <---- CHANGED annotations: # These annotations are assuming K3S and cert-manager setup specifics <---- CHANGED traefik.ingress.kubernetes.io/router.entrypoints: websecure # <---- CHANGED traefik.ingress.kubernetes.io/router.tls: "true" # <---- CHANGED cert-manager.io/issuer: letsencrypt-prod # letsencrypt-prod is the issuer I have configured, may be different in other environments # <---- CHANGED ## Prometheus server Ingress additional labels ## extraLabels: {} ## Prometheus server Ingress hostnames with optional path ## Must be provided if Ingress is enabled ## hosts: - prometheus.domain_name.here # IMPORTANT: hostname setup # <---- CHANGED path: / pathType: Prefix extraPaths: [] ## Prometheus server Ingress TLS configuration ## ## The default values file comment is a lie if you have cert-manager. Certs will be created automatically. ## tls: - secretName: prometheus-server-tls hosts: - prometheus.domain_name.here # IMPORTANT: set the hostname for cert-manager to create certs # <---- CHANGEDSetting
enabled: truein the above modifications will create an ingress and certificates automatically, allowing access to Prometheus athttps://prometheus.domain_name.here. Assuming DNS is configured of course.Get the helm chart.
BASH1 2helm repo add prometheus-community https://prometheus-community.github.io/helm-charts helm repo updateInstall - from the
prometheusdirectory we’ve been working in.BASH1helm install prometheus prometheus-community/prometheus -f values.ymlNote down the value of
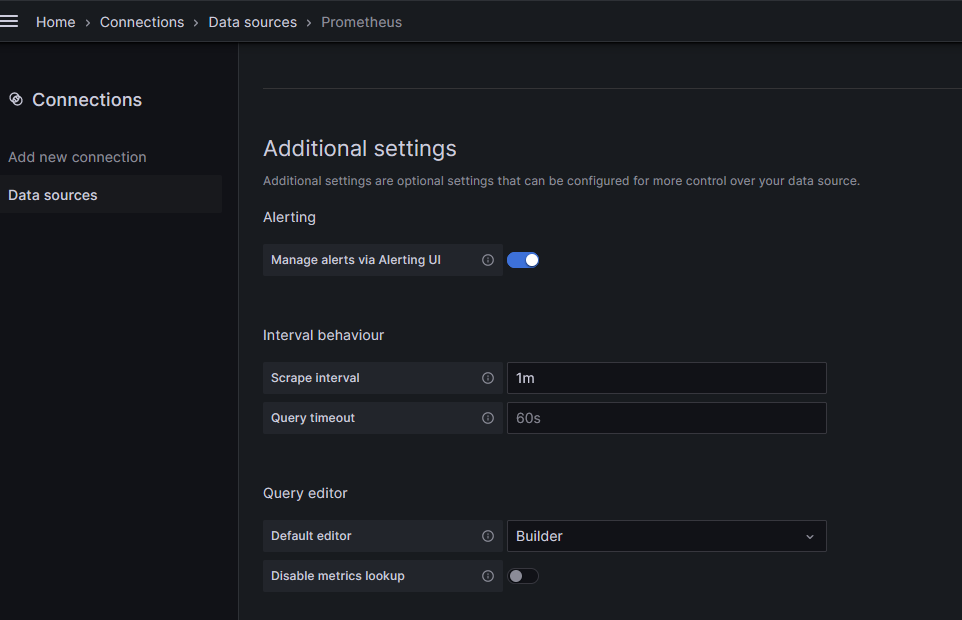
scrape_intervalin values.yml
| |
That’s all there is to it. Prometheus is installed and running. If the ingress above is enabled and DNS is configured, you should be able to poke around on https://prometheus.domain_name.here
Install Grafana
Make a
grafanadirectory in your monitoring repo.Add the unedited contents of the Grafana default values.
Modify values.yml to match your needs.
These are some of the changes I’ve made for my environment:
Ingress section
YAML1 2 3 4 5 6 7 8 9 10 11 12 13 14 15 16 17 18 19 20 21ingress: enabled: true annotations: traefik.ingress.kubernetes.io/router.entrypoints: websecure # <-- changed traefik.ingress.kubernetes.io/router.tls: "true" # <-- changed cert-manager.io/issuer: letsencrypt-prod # <-- changed, allows cert-manager to get my certs labels: {} path: / # pathType is only for k8s >= 1.1= pathType: Prefix hosts: - grafana.domain_name.here # <-- changed ## Extra paths to prepend to every host configuration. This is useful when working with annotation based services. extraPaths: [] tls: - secretName: chart-example-tls hosts: - grafana.domain_name.here # <-- changedPersistence section, necessary to enable storage access to keep the data and configs.
YAML1 2 3 4 5 6 7 8 9 10 11 12 13 14 15 16 17## Enable persistence using Persistent Volume Claims ## ref: http://kubernetes.io/docs/user-guide/persistent-volumes/ ## persistence: type: pvc enabled: true # <-- changed. Enables storage # storageClassName: default accessModes: - ReadWriteOnce size: 10Gi # annotations: {} finalizers: - kubernetes.io/pvc-protection extraPvcLabels: {} inMemory: enabled: falseGet the helm chart.
BASH1 2helm repo add grafana https://grafana.github.io/helm-charts helm repo updateInstall - from the
grafanadirectory we’ve been working in.BASH1helm install grafana grafana/grafana -f values.ymlOutput should include instructions to get your initial admin password. Don’t forget to change this in the WebUI!
Assuming DNS is configured, Grafana should now be reachable at
https://grafana.domain_name.hereGet your prometheus internal to the cluster IP - you’ll need this to setup Grafana.
BASH1 2# kubectl get service | grep prometheus-server prometheus-server ClusterIP 10.43.198.203 <none> 80/TCP 3h21mIn this case, I needed to note down 10.43.198.203 as the Prometheus IP address. When you add your Prometheus data source, use this IP.
Complete documentation for adding data sources to Grafana.
NOTE: Scrape interval in Grafana must match the configured Prometheus scrape interval


