Monitoring Synology NAS with Prometheus & SNMP
My Synology NAS is a very important part of my home network, and until recently it was practically unmonitored. Synology doesn’t make it easy to monitor their NAS devices out of the box. It’s possible to get Prometheus’ node exporter running, but that doesn’t export all of the metrics of interest and is generally a pain to deal with. I also prefer to minimize the number of things running on my NAS. It’s under enough load as is.
So what to do? Synology exposes metrics over SNMP. Prometheus has a handy snmp exporter. It’s a bit of a pain to get setup, but it does get metrics into my preferred monitoring solution.
Requirements & Goals
- Get Synology metrics into Prometheus.
- Setup Dashboards in Grafana.
- Setup alerting for the NAS.
- Fully automated - no manual actions.
- Secure - everything should be encrypted, and no plaintext password storage.
NAS Configuration
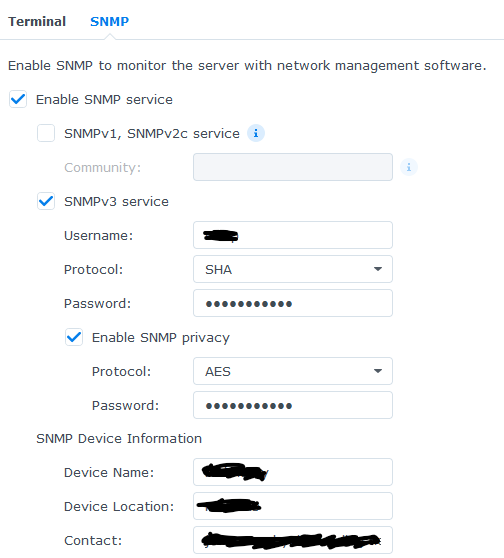
First the NAS must be configured to enable SNMP. In the WebUI Control Panel -> Terminal & SNMP -> SNMP, enable SNMP and configure SNMPv3. SNMPv1 and SNMPv2 are not secure and should not be used.
SHA is better than MD5, and AES is better than DES.
Generate snmp_exporter config
The snmp_exporter config must be generated, default configuration will not work.
Clone snmp exporter.
Checkout the version you intend to deploy. Unreleased versions may not work. You can see the releases on GitHub and then can checkout the Tag. The latest release at the time of writing is
v0.24.1.BASH1git checkout tags/v0.24.1Follow the instructions in the README in
generator/README.mdof the repository.Download the synology mibs. There is a link on the page where the NAS SNMP was enabled. Place the mibs in
generator/mibs.Edit generator.yml. Most of the defaults are not relevant and can be deleted. For the initial version, I’ve taken the default synology config in the generator.yml and removed almost everything else. This is my initial redacted version, important alterations are at the very top:
YAML1 2 3 4 5 6 7 8 9 10 11 12 13 14 15 16 17 18 19 20 21 22 23 24 25 26 27 28 29 30 31 32 33 34 35 36 37 38 39 40 41 42 43 44 45 46 47 48 49 50 51 52 53 54 55 56 57 58 59 60 61 62 63 64 65 66 67 68 69 70 71 72 73 74 75 76 77 78 79 80 81 82 83 84 85 86 87 88 89 90 91 92 93 94 95 96 97 98 99 100 101 102--- auths: synology: # <-- this section is added: This name is important later version: 3 username: THE_CONFIGURED_USERNAME security_level: authPriv password: THE_CONFIGURED_PASSWORD auth_protocol: SHA priv_protocol: AES priv_password: THE_CONFIGURED_PRIV_PASSWORD modules: # Default IF-MIB interfaces table with ifIndex. if_mib: walk: [sysUpTime, interfaces, ifXTable] lookups: - source_indexes: [ifIndex] lookup: ifAlias - source_indexes: [ifIndex] # Uis OID to avoid conflict with PaloAlto PAN-COMMON-MIB. lookup: 1.3.6.1.2.1.2.2.1.2 # ifDescr - source_indexes: [ifIndex] # Use OID to avoid conflict with Netscaler NS-ROOT-MIB. lookup: 1.3.6.1.2.1.31.1.1.1.1 # ifName overrides: ifAlias: ignore: true # Lookup metric ifDescr: ignore: true # Lookup metric ifName: ignore: true # Lookup metric ifType: type: EnumAsInfo # Default IP-MIB with ipv4InterfaceTable for example. ip_mib: walk: [ipv4InterfaceTable] synology: walk: - laNames - laLoadInt - ssCpuUser - ssCpuSystem - ssCpuIdle - memory - hrStorage - 1.3.6.1.4.1.6574.1 # synoSystem - 1.3.6.1.4.1.6574.2 # synoDisk - 1.3.6.1.4.1.6574.3 # synoRaid - 1.3.6.1.4.1.6574.4 # synoUPS - 1.3.6.1.4.1.6574.5 # synologyDiskSMART - 1.3.6.1.4.1.6574.6 # synologyService - 1.3.6.1.4.1.6574.101 # storageIO - 1.3.6.1.4.1.6574.102 # spaceIO - 1.3.6.1.4.1.6574.104 # synologyiSCSILUN lookups: - source_indexes: [spaceIOIndex] lookup: spaceIODevice drop_source_indexes: true - source_indexes: [storageIOIndex] lookup: storageIODevice drop_source_indexes: true - source_indexes: [serviceInfoIndex] lookup: serviceName drop_source_indexes: true - source_indexes: [diskIndex] lookup: diskID drop_source_indexes: true - source_indexes: [raidIndex] lookup: raidName drop_source_indexes: true - source_indexes: [laIndex] lookup: laNames drop_source_indexes: true - source_indexes: [hrStorageIndex] lookup: hrStorageDescr drop_source_indexes: true overrides: diskModel: type: DisplayString diskSMARTAttrName: type: DisplayString diskSMARTAttrStatus: type: DisplayString diskSMARTInfoDevName: type: DisplayString diskType: type: DisplayString modelName: type: DisplayString raidFreeSize: type: gauge raidName: type: DisplayString raidTotalSize: type: gauge serialNumber: type: DisplayString serviceName: type: DisplayString version: type: DisplayStringGenerate the snmp.yml file
BASH1make generateVerify the snmp.yml file is correct. Download the appropriate snmp exporter binary from the releases. Copy the snmp.yml file into the directory with the binary. Run the following commands to verify.
From terminal 1:
BASH1./snmp_exporterFrom terminal 2:
BASH1 2curl 'http://localhost:9116/snmp?target=<SYNOLOGY_NAS_IP_HERE>&auth=synology&module=if_mib' curl 'http://localhost:9116/snmp?target=<SYNOLOGY_NAS_IP_HERE>&auth=synology&module=synology'Both curl commands should spit out a long list of metrics.
Install snmp_exporter and snmp.yml
Choose the host you want to have polling your NAS for metrics and install the snmp_exporter and the generated snmp.yml file. There are instructions for this in the snmp_exporter git repo.
I’ve written another post on how I deploy snmp_exporter with Ansible.
Update Prometheus config to scrape snmp
My Prometheus is configured via helm, details here. Update the extraScapeConfigs in values.yml with configs for snmp.
| |
For verification I also enabled ingress to Prometheus temporarily. This was very helpful for debugging a few silly typos. On the Prometheus WebUI go to status -> targets and find the SNMP.
Don’t forget to disable the ingress when done.
Create Dashboards and Alerts in Grafana
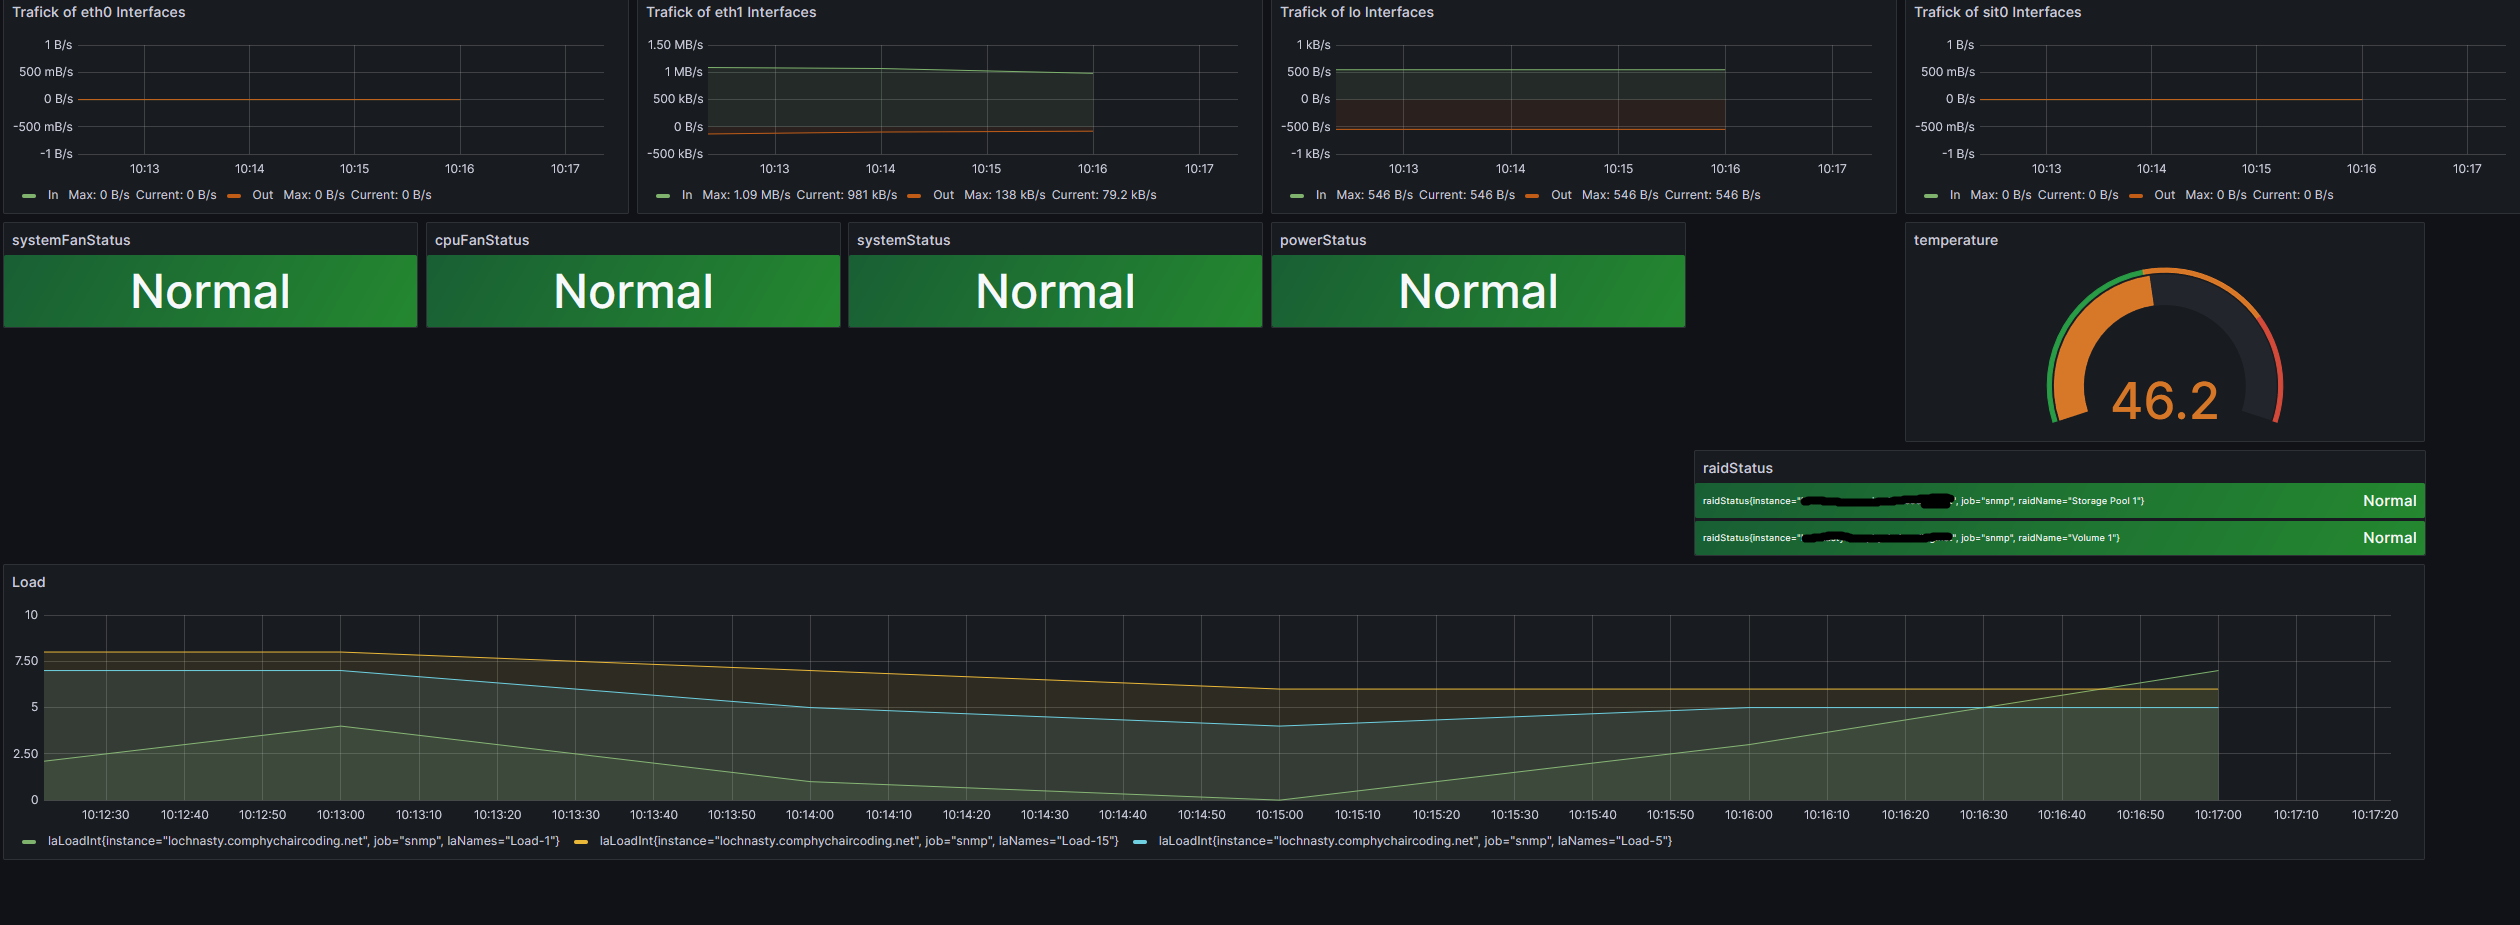
This dashboard is an excellent place to start. Congratulations, you have monitoring for your NAS!
As you can see, there were immediate action items when I first brought up the dashboard. My NAS had been running rather warm, and the fans were set to quiet mode. Thanks to the monitoring, that was an easy fix before it became an issue.
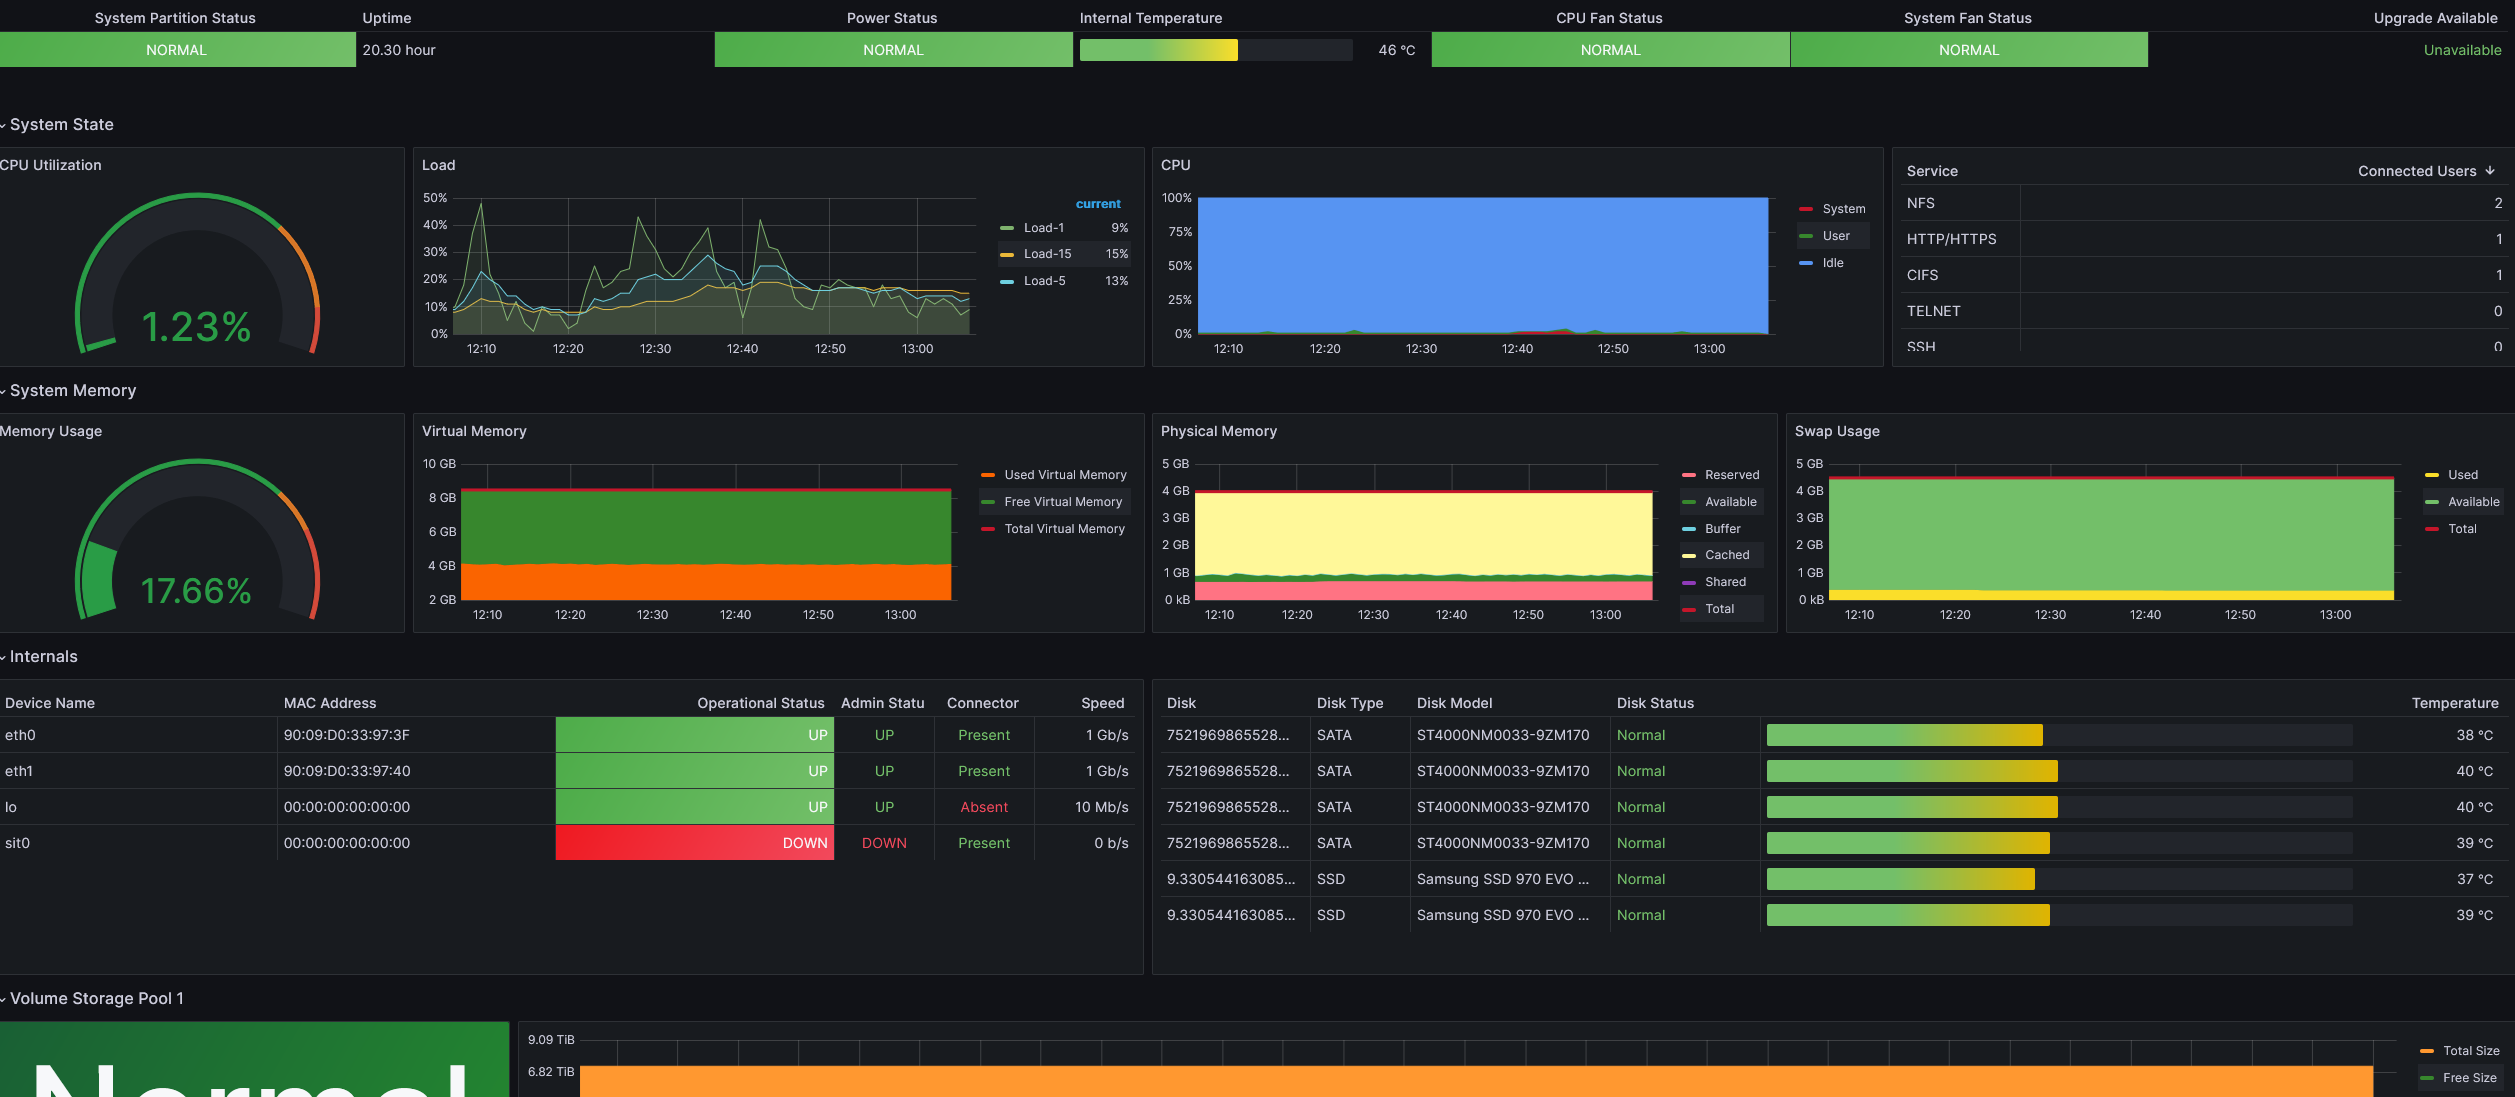
An improved dashboard that requires some modification is here. Several changes are required:
- Alter the job query param in every graph to match the job used (snmp in this article).
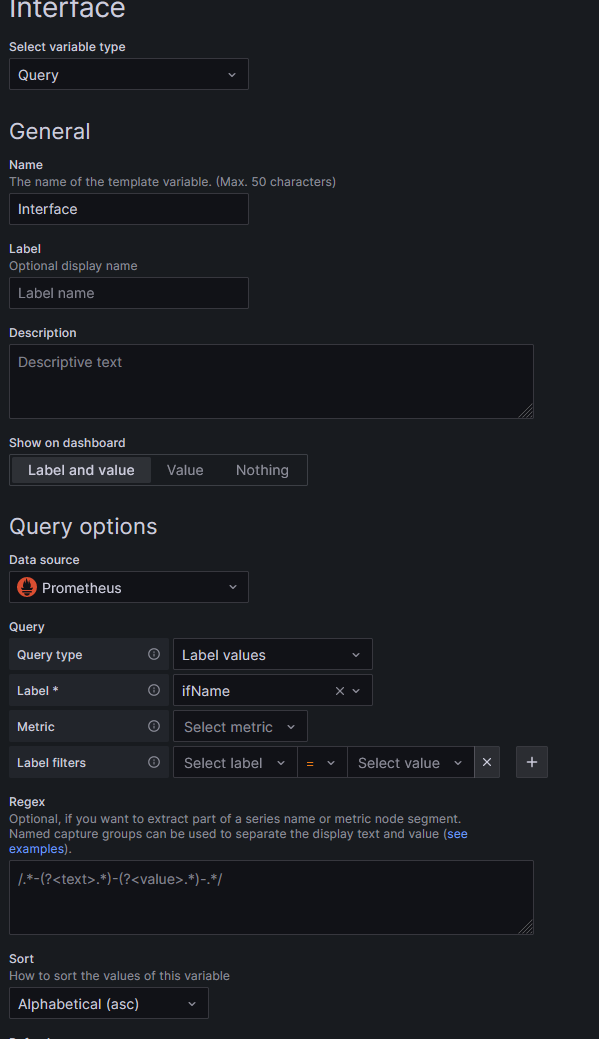
- Alter the interface variable in the dashboard. The default query does not work for me:
Final results:
Conclusion
Prometheus is now configured to pull SNMP metrics from the NAS, dashboards and alerts are now configured. I’m leaving the alerting config as an exercise for the reader.


