
Home Assistant: Generating Dashboard Graphs From Sensors
Over time I’ve developed a reasonably useful to me home assistant dashboard of all temperature and humidity sensors around my house. This was built manually over time, and whenever I add or remove a sensor I would have to update the dashboard myself. Obviously, I never remember to do so until I want to see that data.
Requirements
- Use the same sensor card graph I’ve had setup
- Fully automatically generated. If I bring a new temperature+humidity sensor online, it should automatically be added to the dashboard. No further interaction required.
- Display each sensor’s Temperature and Humidity graphs next to each other
- Be simple and easy to maintain
It was surprisingly difficult to put together the pieces here to meet all requirements. I would have tolerated generating this dashboard sever side at startup, and in fact did consider writing some templating code to just generate the dashboard from all entities. In the end, I found lovelace-auto-entities and leveraged that project.
Broad strokes
Utilize auto-entities to select all sensors that have a temperature device class. Place each found entity in a sensor card with a line graph. Repeat for humidity.
For nice organization, place both auto-entities in a horizontal stack, and sort both the same way. Now each sensor has temperature and humidity lined up next to each other.
Tricky part
Getting the sensor card to play nice with auto-entities. In order to define an individual card per found entity, you have to modify the filters section. While this works, I find it to be completely unintuitive. In my mind, I’m trying to display data at this point not filter data out.
Even more confusing, auto-entities has a card type, as well as a card_param argument. It seems like you should be able to directly configure a sensor per entity using these types, but no.
Final, full dashboard
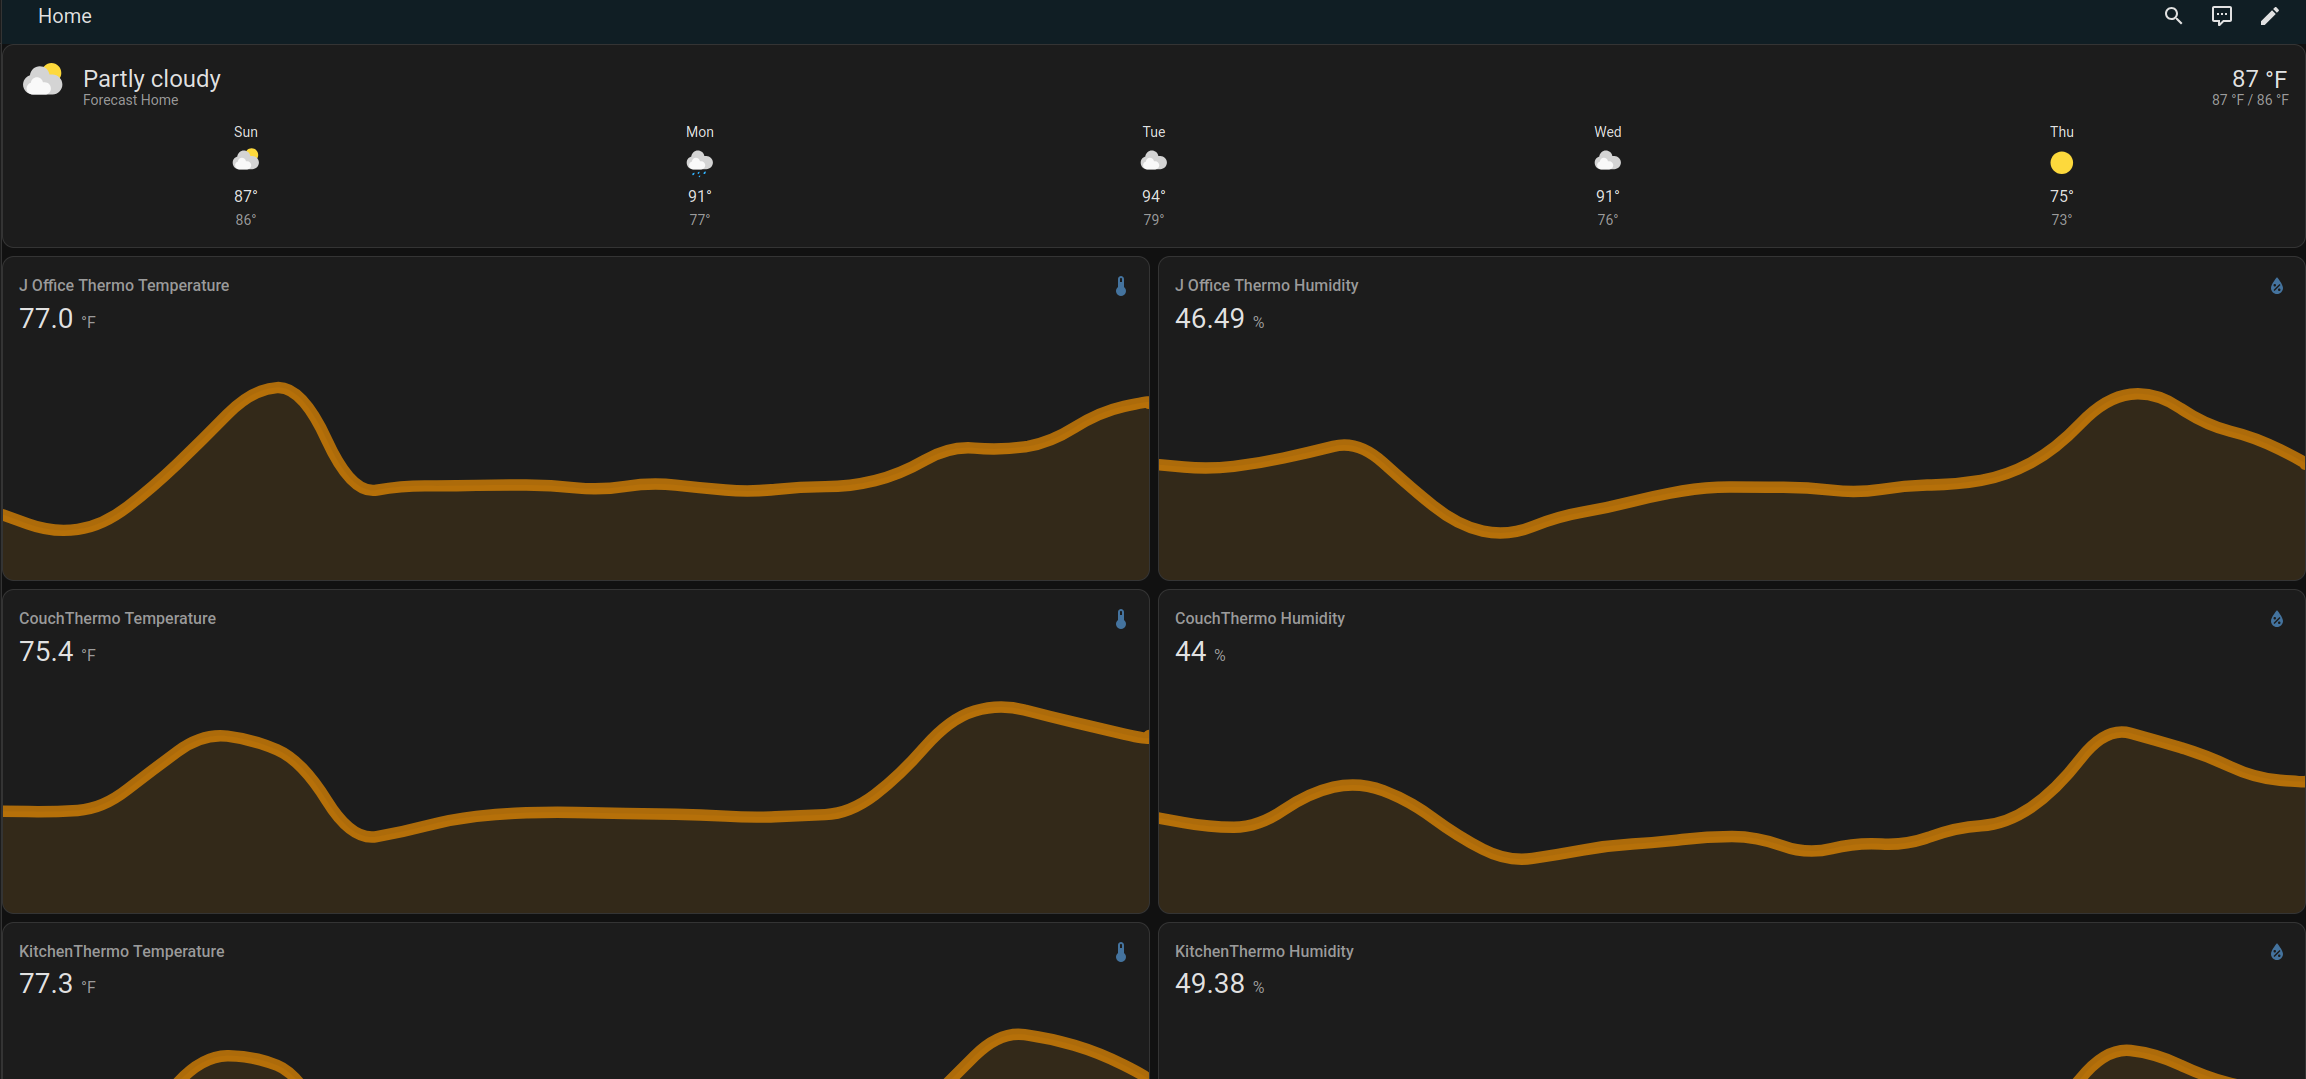
| |
How to break this dashboard
If a sensor is ever added that does not also expose a humidity sensor, then this display will no longer be properly aligned. In theory, there should be a way to exclude or require a 1 - 1 mapping of temperature and humidity but I have not figured that out yet.